Tracking how global migration shapes Illinois
Welcome back to Data Detective, where we walk step by step through public data to uncover what’s really happening in Illinois’ economic and demographic landscape.
In recognition of Asian American, Native Hawaiian, and Pacific Islander (AANHPI) Heritage Month, this edition explores a key question:
Which AANHPI communities have been growing in Illinois in recent years?
To answer that, we’ll turn to federal immigration data and walk through how to build a multi-year dataset from scratch.
What defines a member of the AANHPI group?
Before diving into the data, it’s important to define what we mean by AANHPI.
For the purposes of this analysis, AANHPI includes individuals with origins in:
- East Asia (e.g., China, Japan, Korea, Taiwan)
- South Asia (e.g., India, Pakistan, Bangladesh, Sri Lanka, Nepal)
- Southeast Asia (e.g., Vietnam, Thailand, Indonesia, Philippines, Malaysia)
- The Pacific Islands (e.g., Fiji, Samoa, Tonga, Micronesia)
- Central Asia (e.g, Kazakhstan, Uzbekistan, Turkmenistan, Kyrgyzstan)
It’s worth noting that this is a constructed grouping, not a single, unified demographic. Trends within the AANHPI population can vary significantly depending on the populations included.
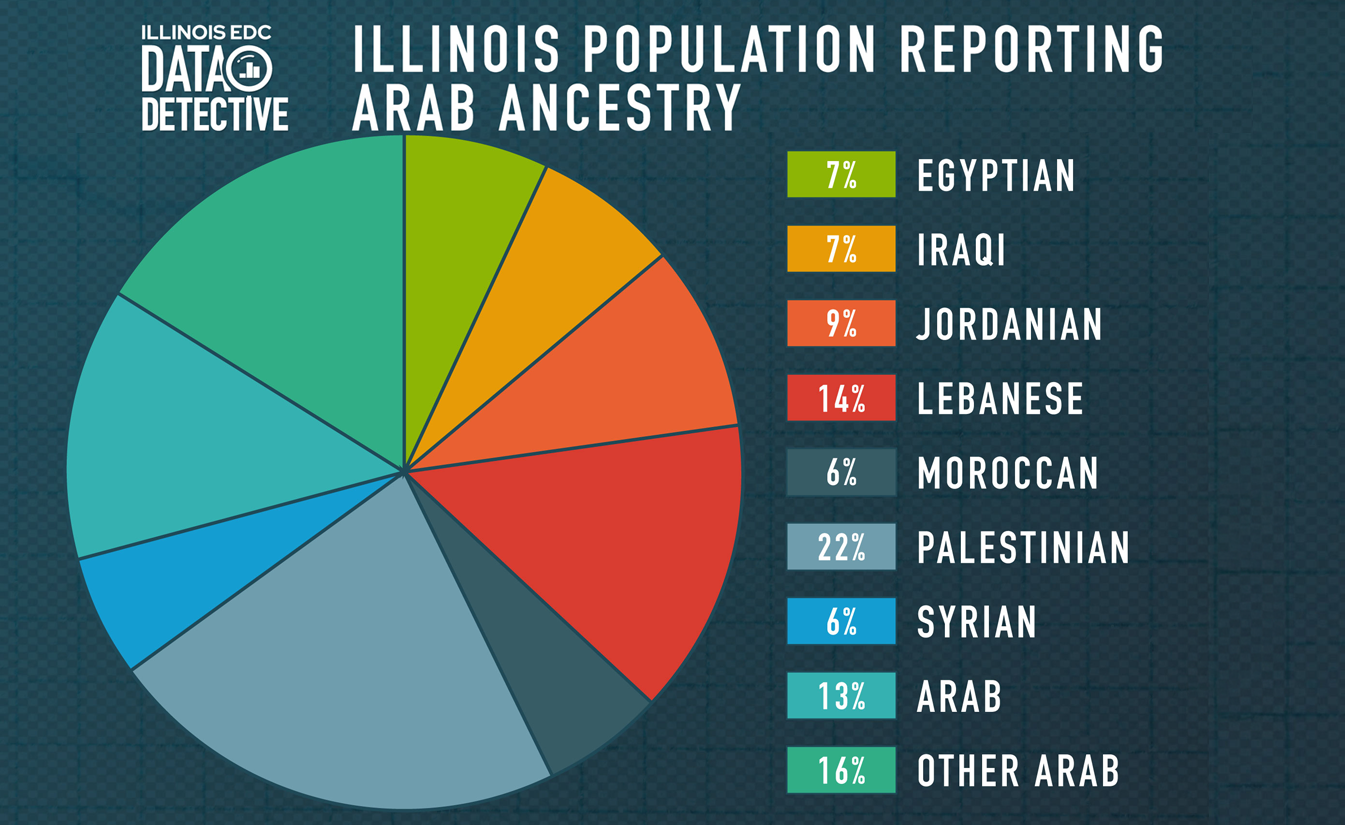
For the purposes of this analysis, Arab American populations are excluded, as they were covered separately during Arab American Heritage Month.
Step 1: Navigating DHS Data
To explore immigration patterns, we’ll turn to the Office of Homeland Security Statistics, which publishes detailed data on immigration to the United States.
From the homepage:
- Select ‘Data and Reports by Topic’
- Click ‘Immigration’
- Navigate to ‘Lawful Permanent Residents (LPR)’
- Within this section, locate the dataset titled:
- ‘LPR by State, County, Country of Birth, and Major Class of Admission’
This dataset is particularly useful because it allows us to break down immigration by:
- Where people settle (state and county)
- Where they come from (country of birth)
- How they arrived (family-based, employment-based, refugee/asylee, etc.)
Download the Excel files for the most recent five years available (in this example, we’re using data from 2019–2023).
Step 2: Review the Data
Each file contains immigration data for a given year. You’ll notice that counties are limited to the top 200 most populous counties in the U.S.
For Illinois, this includes the following counties:
- Cook County
- DuPage County
- Kane County
- Lake County
- Will County
While this does not capture every county in Illinois, it does represent the majority of immigration activity in the state, particularly concentrated within the Chicago metropolitan area.
Before moving forward, make sure to convert each dataset into a table (Format as Table in Excel) and save each file for use in the next step.
Step 3: Building a Multi-Year Dataset
Because each file represents a single year, we’ll need to combine them to analyze trends in immigration patterns over time.
In Excel:
- Go to the Data tab
- Select Get Data → From File → From Workbook
- Load your first dataset
- In the query editor, repeat this process for each additional year
Once all datasets are loaded in the Query Editor, select ‘Append Queries’ to combine them into one unified table.
Step 4: Cleaning the Data
Before analyzing the data, we need to address one common issue. In the Admissions column, some values appear as “D”, which indicates that the data has been suppressed to protect confidentiality.
To ensure the dataset can be aggregated correctly, select the ‘Admissions’ column and use the Find and Replace command (Ctrl + F). Replace all instances of “D” with 0.
While this does not recover the suppressed values, it ensures that totals can be calculated without errors.
Step 5: Creating a PIVOT Table
We’re ready to create a multi-year analysis. Select the ‘Insert’ menu create a PIVOT table. The table’s range should be automatically selected. Structure the PIVOT table as follows:
- Columns:
- State of Residence
- County of Residence
- Make sure State of Residence is placed above County for readability
- Rows:
- Country of Birth
- Values:
- Admissions (set to Sum, not Count)
To focus on AANHPI countries, filter the Country of Birth field to include relevant countries across Asia and the Pacific Islands:
- Afghanistan
- American Samoa
- Bangladesh
- Bhutan
- Brunei
- Burma
- Cambodia
- China, People’s Republic
- Cook Islands
- Fiji
- French Polynesia
- Hong Kong
- India
- Indonesia
- Japan
- Kazakhstan
- Kiribati
- Korea, North
- Korea, South
- Kyrgyzstan
- Laos
- Macau
- Malaysia
- Maldives
- Marshall Islands
- Micronesia, Federated States
- Mongolia
- Nauru
- Nepal
- New Caledonia
- Pakistan
- Palau
- Papua New Guinea
- Philippines
- Samoa
- Singapore
- Solomon Islands
- Sri Lanka
- Taiwan
- Tajikistan
- Thailand
- Tonga
- Turkmenistan
- Tuvalu
- Uzbekistan
- Vanuatu
- Vietnam
- Wallis and Futuna
Step 6: What the Data Shows
Once filtered and aggregated, several key insights emerge:
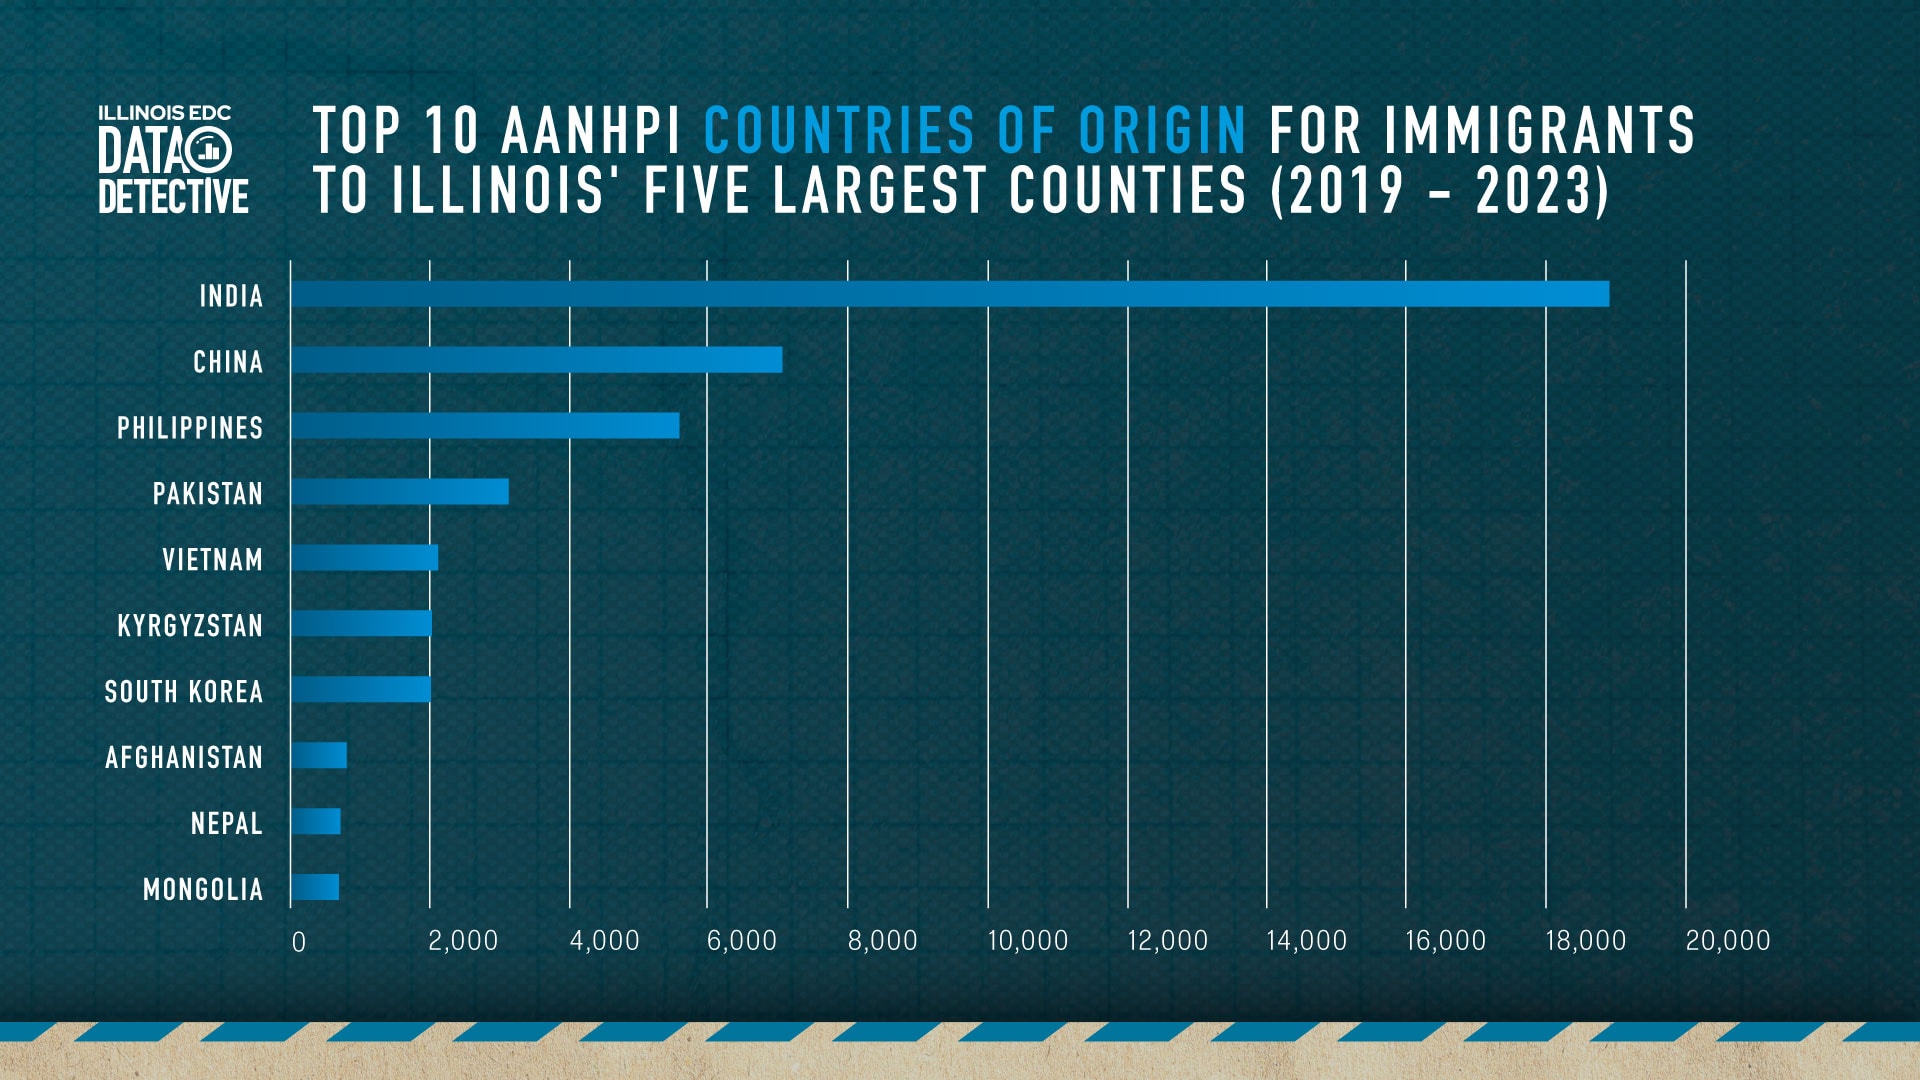
- Illinois’ five largest counties received over 47,651 AANHPI lawful permanent residents between 2019 and 2023.
- Among the largest U.S. counties, Illinois ranks among the top destinations for AANHPI immigrants, with the sixth-highest total in the dataset.
- India is the leading country of origin, accounting for over one-third of AANHPI immigration to Illinois during this period, making up 18,910 individuals and counting.
Looking deeper, the dataset also reveals differences in migration pathways. Employment-based immigration is particularly prominent among South Asian and East Asian populations, while refugee and asylee admissions are more common among certain Southeast Asian groups.
For example, 81.3% of Burmese immigrants to Illinois entered as refugees/asylees, totaling 380 refugee arrivals over the five-year period, and all 36 Bhutanese immigrants within the time period were considered refugees.
Key Takeaway
Immigration data is often discussed in broad national terms, but state- and county-level analysis reveals how these trends play out locally.
In Illinois, AANHPI immigration supports key industries and workforce needs, contributes to the state’s entrepreneurial environment, and enriches communities through cultural and social contributions.
The 47,600+ AANHPI immigrants who have settled in Illinois in recent years represent more than just a number. These individuals include workers, business owners, students, families, neighbors, and community members.
By understanding not just how many people are arriving, but where they come from and how they arrive, we gain a more complete picture of the state’s evolving demographic landscape.
And as always, being a good data detective means looking beyond the surface. We ask not just what the data says, but how it’s built and what it reveals.
Get Curious
What data would you like our Research Team to tackle next? Let us know, and we’ll dive in.
Until next time!
RELATED POSTS