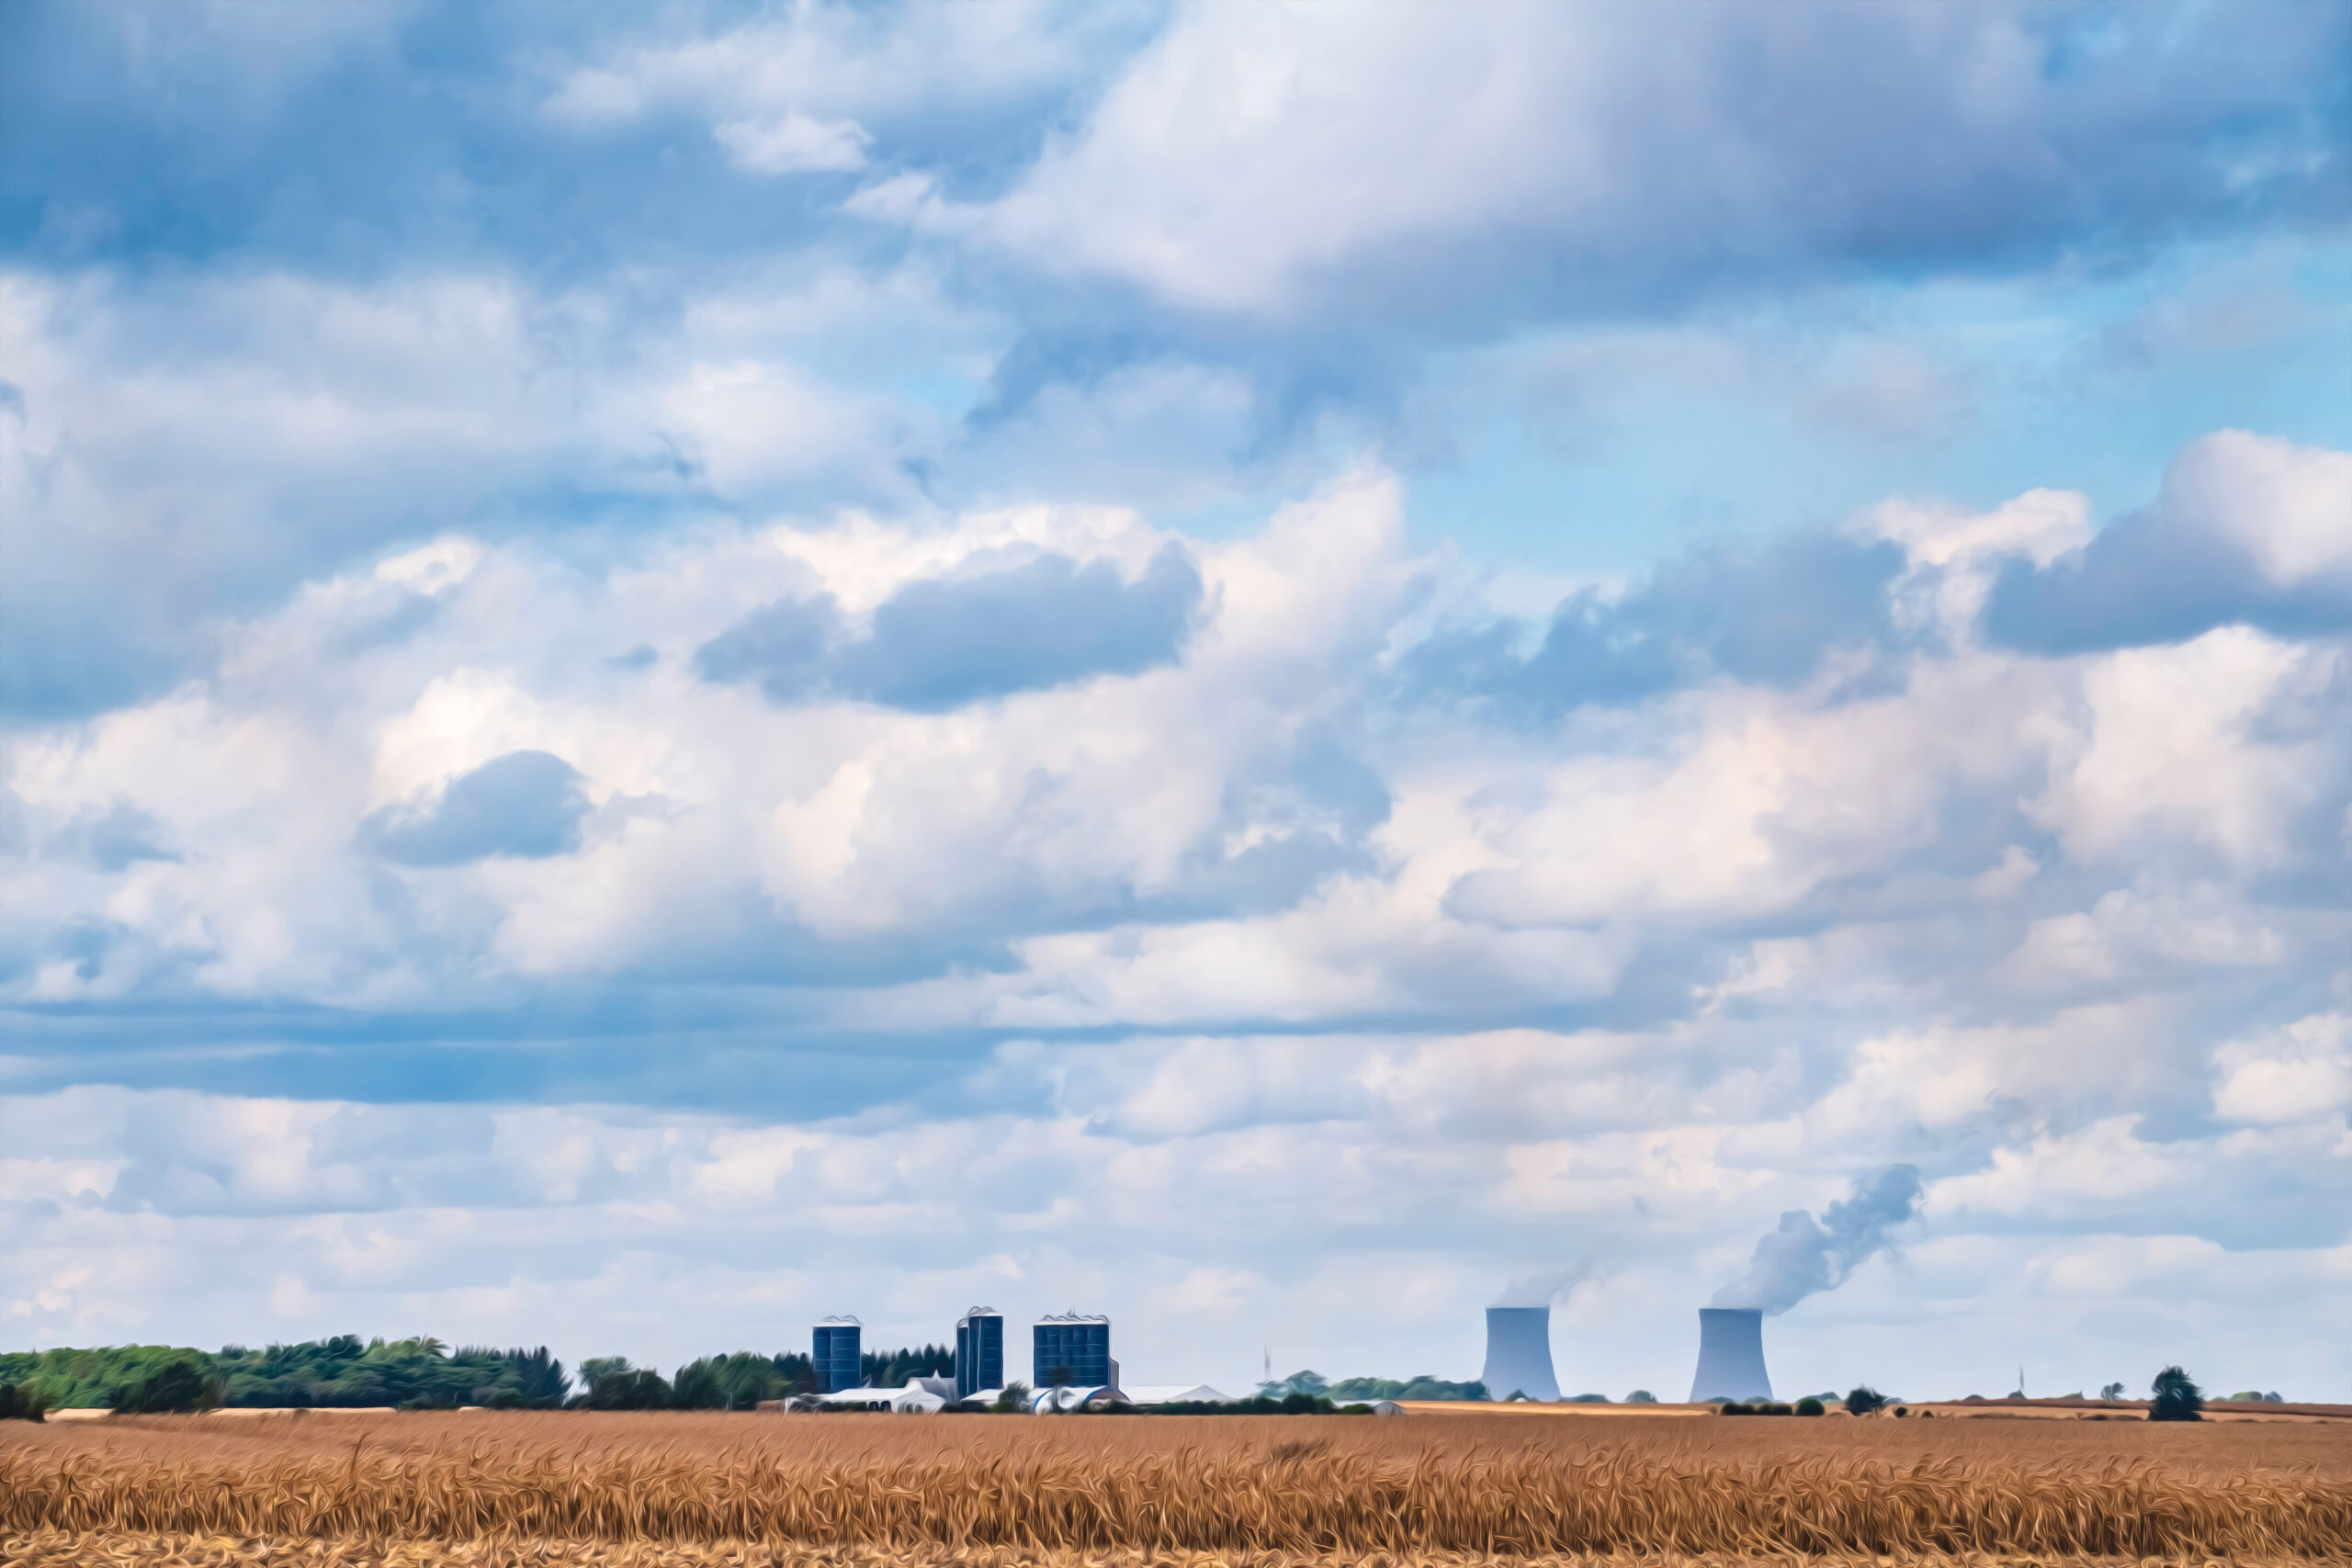
Nuclear in Ogle County, Illinois. Image via Shutterstock.
Welcome back to Data Detective, where we walk step by step through public data to uncover what’s really happening in Illinois’ economic landscape.
This month, we’re plugging into Illinois’ power grid. Clean energy access has become a deciding factor for companies choosing where to locate operations, and Illinois is regularly cited as a leader—but what does the public data show?
This raises the question:
How carbon-free is Illinois’ electricity?
To answer that, we’ll turn to the U.S. EPA’s Emissions & Generation Resource Integrated Database (eGRID)—a comprehensive source of data from EPA’s Clean Air Power Sector Programs on the environmental characteristics of almost all electric power generated in the United States.
Step 1: Navigating EPA Data
Start at the EPA’s eGRID homepage and download the most recent Summary Data release. In this instance, we’ll be working with the 2023 data, ‘eGRID 2023 Summary Tables’. For even more information on generation, look at the eGRID2023 file under Detailed Data.
Open the workbook and head to Table 4, “State Resource Mix”. This is the state-level summary, covering states’ generation resource mixes.
Step 2: Understand the Dataset
Columns include each state’s total annual net generation in MWh, nameplate capacity in MW, and a fuel-by-fuel breakdown of generation resource as a percentage.
NOTE: eGRID tracks nuclear separately from “renewables” (biomass, hydropower, geothermal, wind, and solar). Both are carbon-free at the point of generation, so we’ll look at them together as Illinois’ full clean-energy picture.
Step 3: Pull Illinois’ Numbers and Benchmark
Upon locating Illinois’ data, we find that the state generated:
- 177.7 million MWh in total net generation (#5 in the U.S.)
- Nuclear energy accounts for 54.9% of the state’s entire generation mix
- Multiplying Illinois’ total generation by its nuclear share shows Illinois generated:
- 97.6 million MWh in nuclear generation (#1 in the U.S.)
Illinois’ nuclear fleet alone generated roughly 22 million MWh more than the #2 state, Pennsylvania, with nearly 30% greater generation power than this competitor.
Step 4: Add in Renewables
Combine nuclear with biomass, hydropower, geothermal, wind, and solar, and Illinois’ total carbon-free share of generation reaches 68.5% of its output.
More than two out of three megawatt-hours generated in Illinois in 2023 came from a source that produced no carbon emissions at the point of generation.
NOTE: Nuclear energy is classified as clean, but not as renewable, because it relies on nonrenewable mined materials. It produces nearly zero carbon dioxide or other greenhouse gas emissions, which makes it carbon-free.
NOTE: Illinois ranks 5th nationally for wind generation!
Step 5: Compare Emissions Intensity Across the Midwest
Navigate to Table 3, “State Output Emission Rates”—this table contains total output emission rates in lb/MWh. Filter the CO2 output emission rate column to Midwest states, and sort ascending.
Illinois’ rate of 471.7 lbs of CO2 per MWh is the #2 lowest rate in the Midwest. The results are even more fascinating when observing scale. Illinois’ grid is roughly a third as carbon-intensive as neighboring Indiana and Missouri, while generating nearly double Indiana’s total output and more than 2.5 times Missouri’s.
Illinois proves that states can provide both clean energy generation and industrial-scale output.
Key Takeaway
Illinois’ grid produced more energy than all but four other states in 2023 at 177.7 million MWh and kept over two-thirds of it carbon-free. This combination of such a massive scale is rare and valuable for companies evaluating carbon-conscious operations. Companies locating in Illinois don’t have to choose between grid capacity and clean power—they get both!
Get Curious
What data would you like our Research Team to tackle next? Let us know, and we’ll dive in.
Until next time!
RELATED POSTS